Application resources
Read CPU, memory and waiting signals together, then compare covered stable windows when a Release changes.
From cgroup to Attention
Section titled “From cgroup to Attention”When the optional resource profile is enabled, the node agent reads documented cgroup v2 files for regular containers in selected Deployments. It uses read-only access and adds no scheduler, allocation or I/O hot-path probe. Samples are combined into fixed UTC intervals before delivery, so storage and traffic remain bounded.
Every interval keeps covered time, sample and contributor counts, observed and Ready replicas, container and Release identity, and independent source availability. A missing or incomplete interval stays a visible gap. It is never converted to zero.
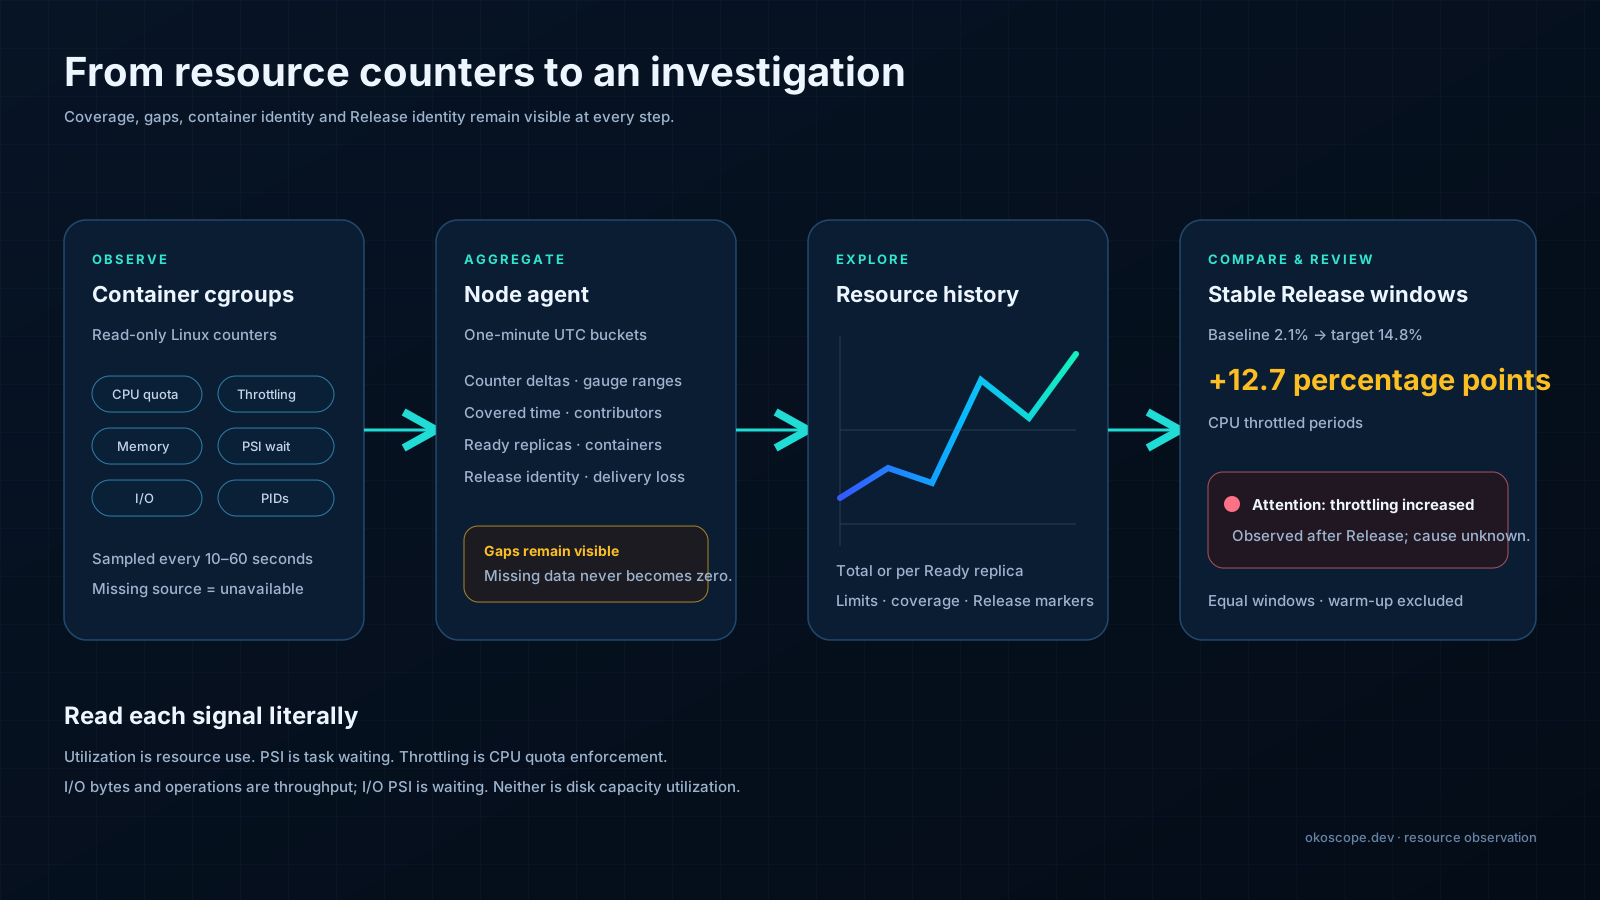
Resource measurements retain coverage and identity from collection to investigation.
CPU use, quota and throttling
Section titled “CPU use, quota and throttling”CPU use is delta usage time divided by covered wall time and is shown as average cores. Quota share exists only when the cgroup has a finite effective quota. Throttled-period share is delta nr_throttled divided by delta nr_periods; throttled duration is a separate signal. Neither value is a percentage of application performance lost.
CPU PSI some measures wall time when at least one runnable task waited for CPU. CPU PSI full is shown only when the kernel source supports it. CPU use, quota enforcement and waiting answer different questions, so inspect them separately.
Memory use and pressure
Section titled “Memory use and pressure”Memory current includes charged cache. Anonymous memory and file cache are separate measurements. Headroom is calculated only against a finite effective limit. memory.high, memory.max, OOM and OOM kill are distinct counter events and should not be collapsed into one generic memory warning.
Memory PSI describes time tasks were delayed by the memory subsystem. It is not RAM utilization. An OOM finding is stronger evidence than a high memory graph, while a utilization increase without limit, pressure or failure evidence remains an ordinary investigation item.
I/O waiting and PID limits
Section titled “I/O waiting and PID limits”Read and write bytes or operations describe throughput attributed to the cgroup. I/O PSI describes time tasks waited on I/O. Okoscope does not know the capacity or saturation of the shared block device, so none of these values is labelled disk utilization percentage.
PID measurements show the current count, finite-limit share and pids.max events. A limit event means a process or thread could not be created under that cgroup limit; the graph does not identify the failed caller.
Compare Releases carefully
Section titled “Compare Releases carefully”Resource impact compares equal-duration stable windows selected from the target deployment episode and its predecessor. Rollout warm-up is excluded, overlapping Releases remain separate, and both data coverage and Ready-replica coverage must be sufficient. While the target window is incomplete, the page says collecting instead of showing an all-clear result.
The result reports baseline, target, absolute change, a relative change only when mathematically valid, and percentage-point change for ratios. The wording says observed after Release. Request volume, traffic mix, external dependencies and scaling can change at the same time, so correlation alone does not establish cause.
Availability, retention and troubleshooting
Section titled “Availability, retention and troubleshooting”The resource profile is disabled by default until measured release gates pass. Operators configure bounded sampling and aggregation in the agent chart. Detailed and rollup retention are independent of runtime-event retention; older detail can expire while compatible rollups remain readable.
If a metric is empty, check profile enablement, workload selection, agent capability resource.utilization/v1, cgroup v2 source availability, delivery-loss counters, the selected time range and retention. Unsupported and no-limit states are reported explicitly; do not interpret either as zero.