Practical workflows
How to get from a question to the evidence that answers it, and then to a decision.
Investigate a new connection
Section titled “Investigate a new connection”Open the Application’s runtime groups and pick a recent observation window. Find the outbound network behavior, look at the destination IP and port and at the process and workload it came from, then open the event evidence that is still available. If there is DNS context, check its confidence, its TTL and whether it is ambiguous. An event with only an IP is perfectly good evidence: you do not need to guess a domain to carry on.
Compare the destination with the dependencies you expect and with what the previous release did. Once you have made up your mind, record the decision as a policy, and confirm it landed by seeing the intended effective policy on the group. Remember what that actually does: it classifies the behavior for review, it does not stop the next connection.
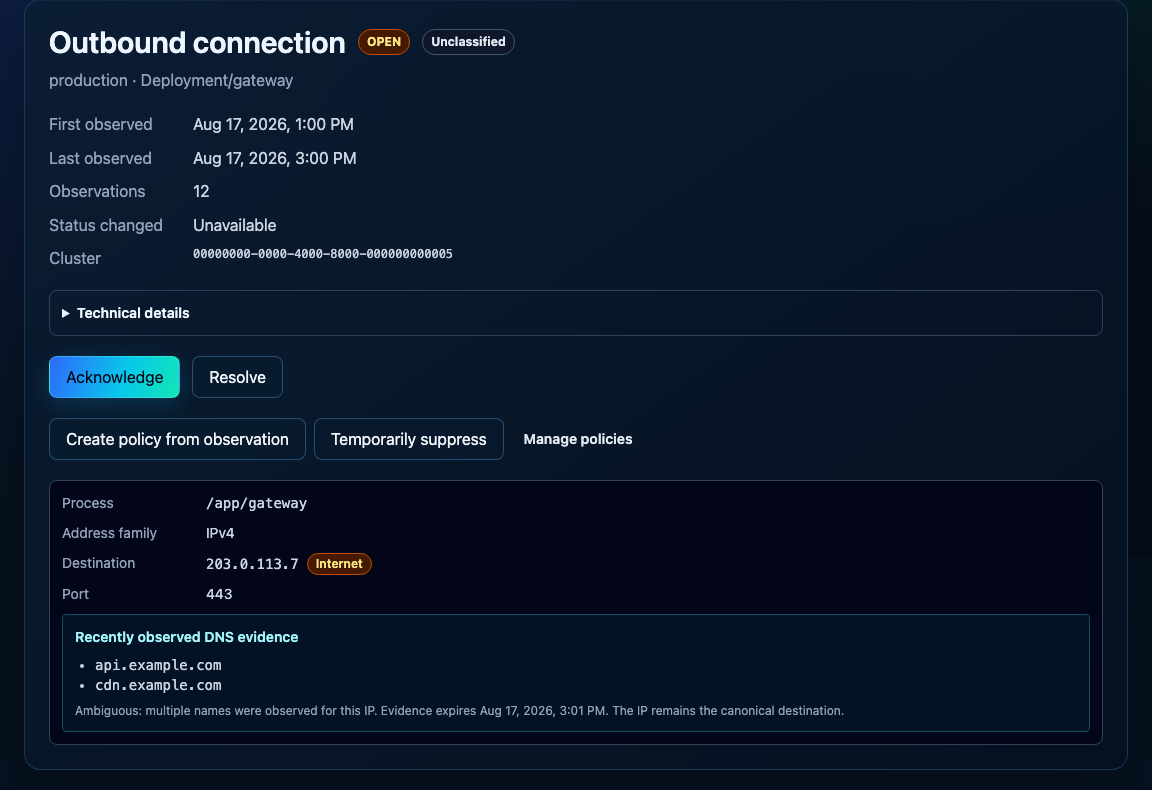
The destination stands on its own; the DNS block states that several names were observed for this IP and when that evidence expires.
Work with Policies
Section titled “Work with Policies”Policies mark observed Application behavior as expected or as something that needs review. They do not block processes or connections, they do not change the lifecycle of findings, and they never delete evidence. To create one you have to be signed in with access to the Application, and you have to start from a retained Runtime Group or inventory observation that can seed a policy.
Destination, domain, system-call, and file-activity policies describe canonical Application behavior rather than a Linux thread command. A matching policy applies to every process thread in its configured placement scope. Runtime Groups still show the process command that produced their evidence.
Open the Runtime Group or the inventory observation and choose Create policy from observation. Give it a name, check the placement scope shown in the dialog, and select Preview impact — the preview is required before anything is created. It tells you how many groups and sightings would be affected, and how many of them would come out expected or requiring review. If the observation cannot seed a policy at all, the dialog says so instead of creating one.
After creating it, open Managed policies from the Application. There you see the current revision, what it affects inside and outside its scope, and the revision history; Enable and Disable switch it on and off. The current interface has no edit action for an existing policy revision. While results are being recomputed, observations show Evaluating policy; when that finishes, check the effective verdict in Runtime Groups or Inventory, and use the verdict and evaluation filters to find the behavior it touched.
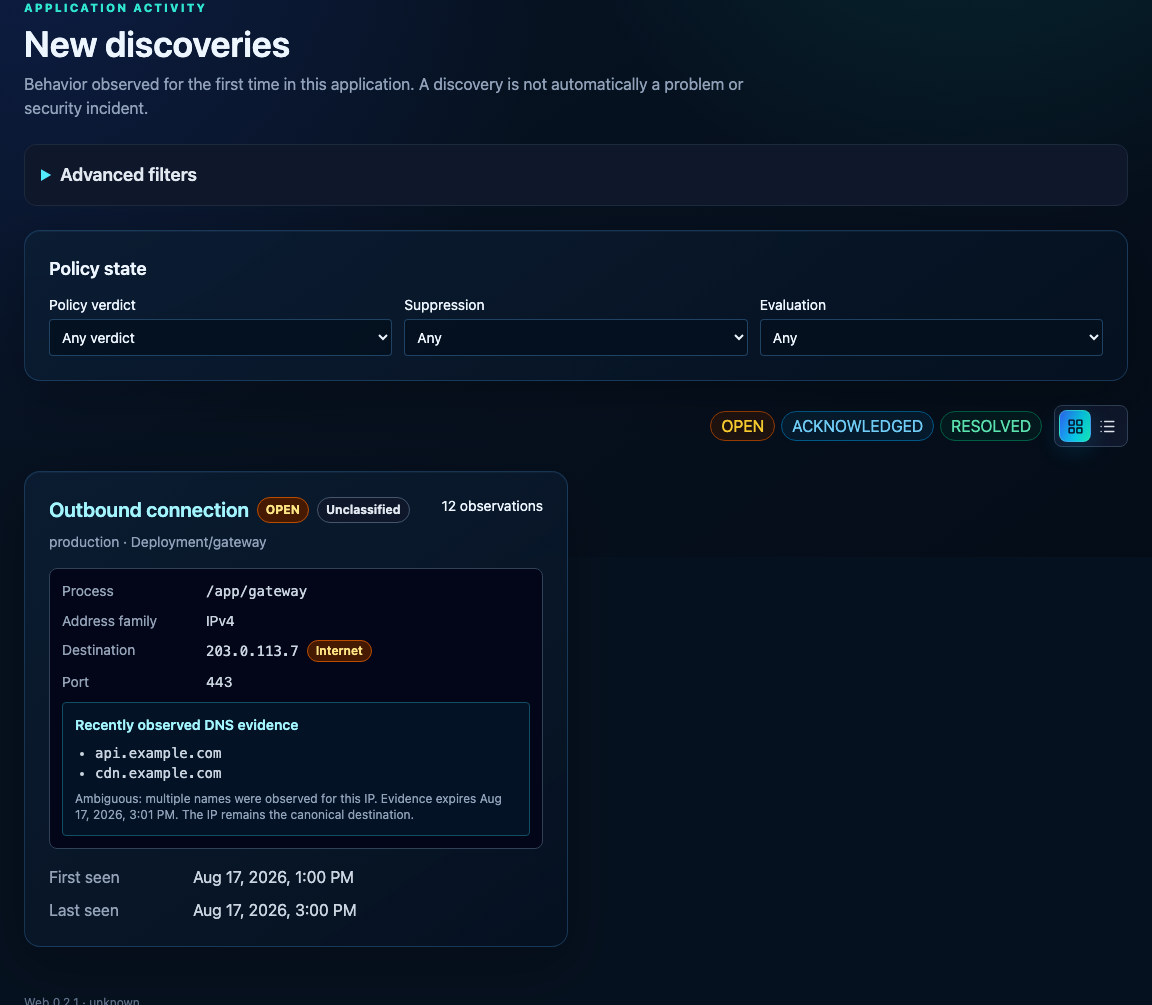
The policy verdict, suppression and evaluation filters are how you find the behavior a policy touched. Here the group is still Unclassified.
Compare releases
Section titled “Compare releases”In the Application’s Releases view, choose a baseline and a target and open the runtime comparison. Check the image identities and the observation windows first — that is what makes everything after it meaningful. Then go through the behavior that appeared, disappeared or changed, with its counts and timestamps. Different traffic, or a startup path that one window covered and the other did not, explains a lot of differences that are not defects at all.
Say out loud when coverage is unknown. A numeric history can outlive the details behind it, and expired evidence cannot support a confident claim that something never happened. Finish by opening a representative event that is still stored, or by noting that the details are no longer available.
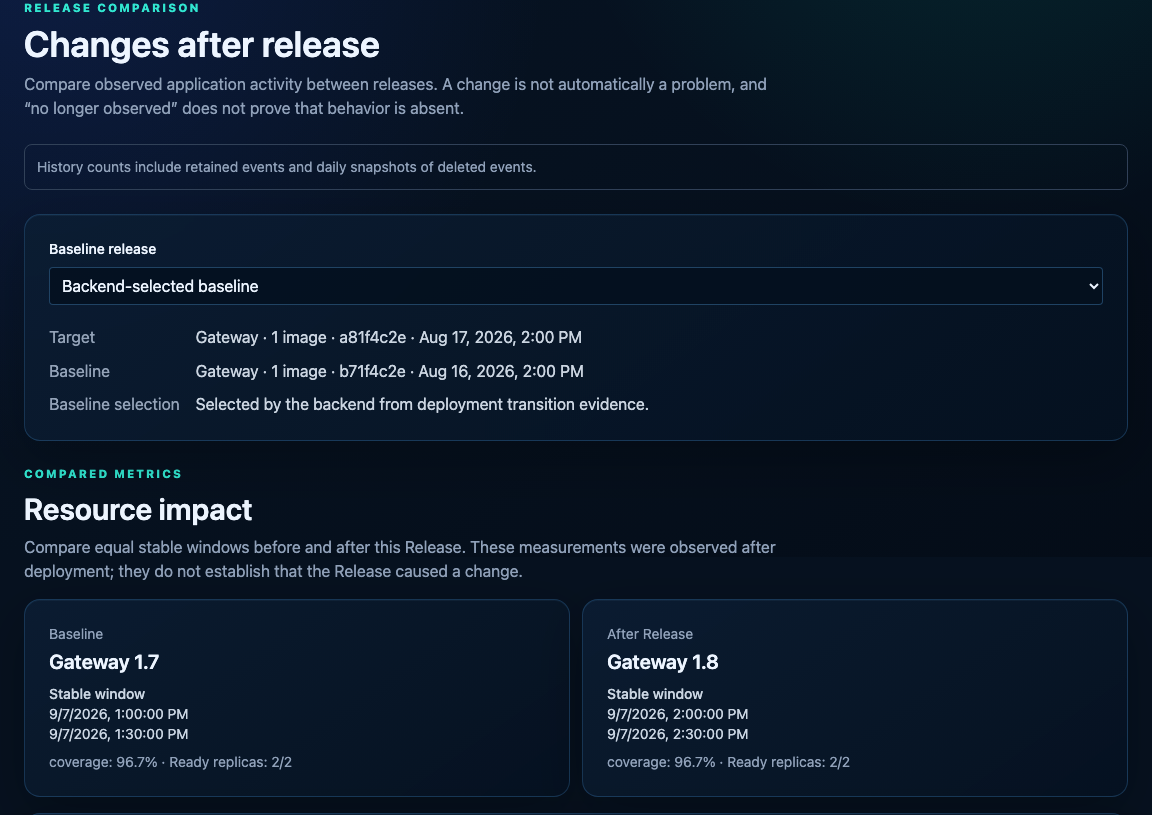
Check the image identities and the observation windows before reading the counts. Unknown is a separate answer from No longer observed.
Explain a restart
Section titled “Explain a restart”Start from the finding that needs attention, or from the termination itself, look at the container and workload involved, then line the time up against release changes and whatever exit evidence exists. Keep three things apart: the signal the process received, the termination reason Kubernetes reported, and the restart evidence. Not every exit with signal 9 is an out-of-memory kill.
Use the finding as a pointer, not as an answer: check the workload limits, the application logs and the Kubernetes events with the tools you normally use. If the evidence you need has expired or was never collected, leave the cause open. An unresolved restart is a better outcome than a plausible story nothing supports.
Configure and verify notifications
Section titled “Configure and verify notifications”In Project notifications, add a destination you are authorized to send to, along with the rules it supports. Look over the destination and the effective settings before you save. Saving alone starts nothing: the operator has to enable the delivery worker. Then trigger a controlled finding that qualifies, and check its delivery record and attempts.
On the receiving side, verify the timestamped HMAC signature and deduplicate by the delivery ID, which stays stable. Recovery keeps that ID, so a retry can reach a receiver that already processed the payload. Read what a retry or a cancel will do before you confirm it — an active lease can prevent cancellation. The health snapshot is what separates a worker that is disabled from one that is retrying or failing.
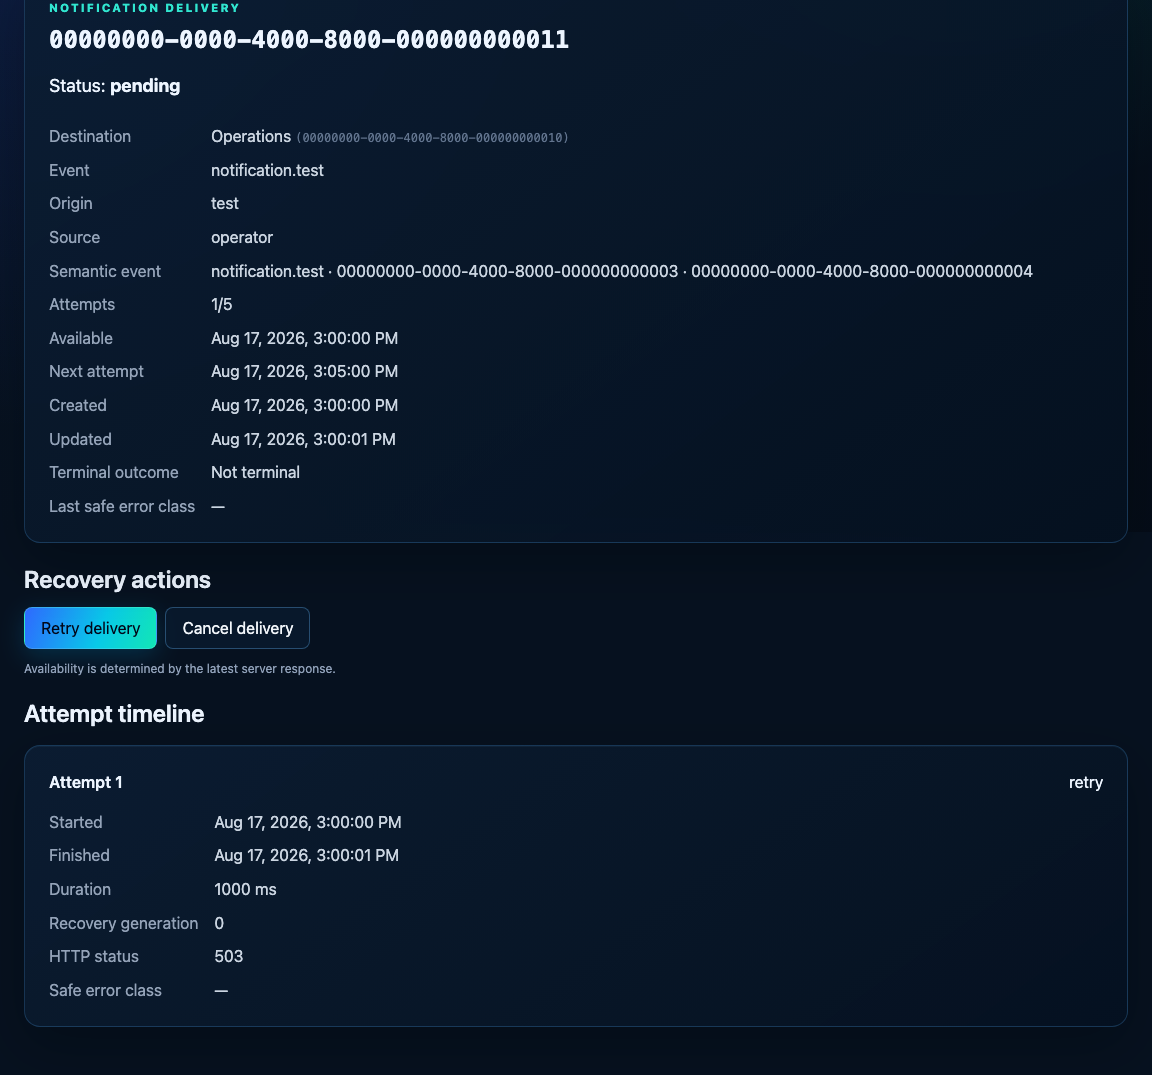
The delivery record is tracked separately from the finding. Deduplicate on this delivery ID: it survives a retry.