Capabilities
What each kind of observation tells you, and when it is worth turning on.
Check observation health first
Section titled “Check observation health first”The Application page shows whether Okoscope is receiving runtime events, how many nodes report status, and the first and latest accepted event times. When data is absent it keeps authentication, workload matching, Kubernetes permissions, kernel support, waiting for traffic, stale reporting and revoked credentials as separate states, with a next check for each.
A recent agent signal means only that the server heard from that worker inside its published freshness window. It is not a promise that the stream is connected at this instant, and a worker capability or heartbeat is not proof that a corresponding event was observed. If readiness cannot be refreshed, the page keeps the timestamps but marks freshness unknown instead of guessing.
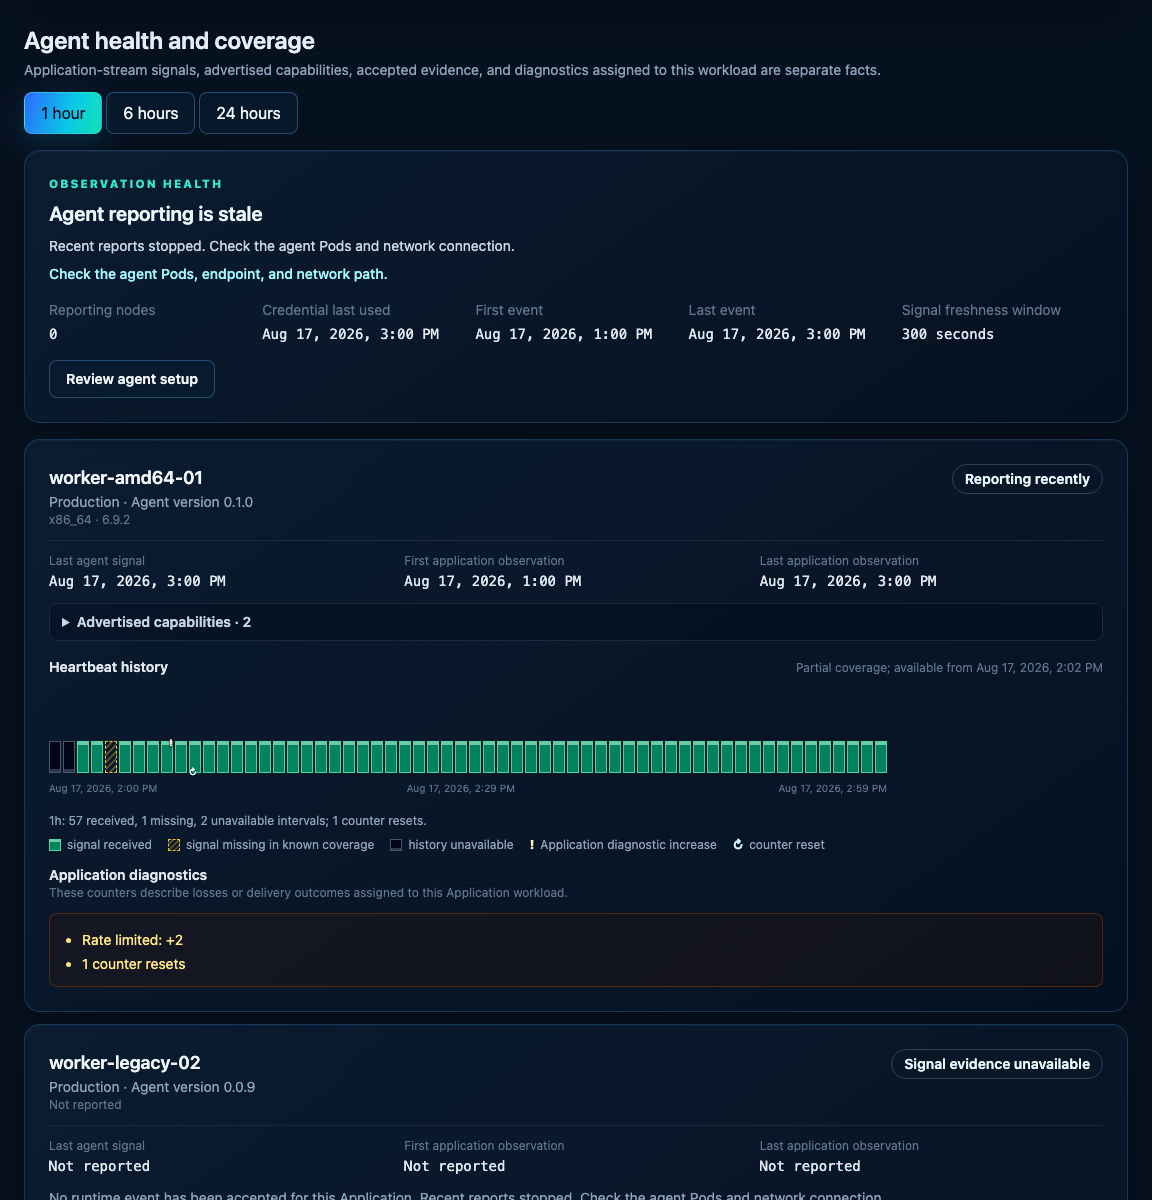
Agent cards retain bounded heartbeat coverage for 1, 6, or 24 hours. The timeline distinguishes received signals, missing signals inside known coverage, and history that is unavailable before collection or outside retention; it never fills gaps by interpolation. The full supported capability set stays visible as a single icon row: advertised capabilities are highlighted, inactive capabilities are gray, and each icon exposes its localized name on hover or keyboard focus. These states describe only what the agent advertised. Accepted Application events remain separate, so a reporting agent with no events is still visible and points back to the readiness explanation.
Application diagnostics are positive changes during the selected range, not lifetime totals. They include only losses and delivery outcomes assigned to the selected workload’s authenticated Application stream, such as a full route queue, route rate limiting, or a delivery retry. Resets are marked separately for that Application route. Failures before workload attribution and other node-wide diagnostics remain in agent logs and internal operator telemetry; they are never projected into an Application. Every accepted heartbeat must include the scoped diagnostic snapshot; incompatible agents are rejected instead of producing an ambiguous compatibility state in the UI. Health history is retained for at least 25 hours, and each response is limited to 20 agents and at most 96 timeline intervals per agent.
Processes, system calls and termination
Section titled “Processes, system calls and termination”Application Activity keeps three process facts separate: process created means the kernel observed creation of a new process, program executed means an existing process loaded an executable image, and process terminated means the observed task was classified as the process leader when it exited. An exec is therefore not presented as process creation. Historical exit evidence that predates task classification remains visible as task terminated (legacy classification) and does not claim that a process leader stopped.
Process execution tells you which executables ran inside the workloads you selected. Turn on processExit if you also want to see process leaders ending, and list the system calls you care about explicitly, ptrace and setns for example. This is a profile you configure, not a recording of every system call the kernel handled.
Choose the separate Threads category in Application Activity to inspect thread churn without retaining every thread as an inventory identity. This application-wide view is separate from inventory kinds, so inventory policy, identity-search, and behavior filters do not apply to it. For the selected time range its panel reports threads created, exited, active at the end and peak active, then groups creation and exit counts by observed Linux thread name. A bounded Other thread names row and an overflow notice prevent unbounded name cardinality. The panel also states whether its initial active count came from observing process creation, a /proc snapshot, or was unavailable. Snapshot races, collection or delivery gaps, an incomplete baseline, and a truncated bounded result make affected totals lower bounds; the interface says At least instead of silently treating them as exact.
The web client reads these bounded, non-cacheable views from GET /api/v1/projects/{project_id}/applications/{application_id}/thread-activity and GET /api/v1/projects/{project_id}/applications/{application_id}/thread-activity/summary. Both accept an explicit from/to time scope; the window route uses opaque cursor pagination. Thread names and counters do not become Runtime Groups, policies, suppressions, notifications, or executable inventory identities.
Thread activity requires server database migration 32 and a compatible runtime agent advertising task.lifecycle/v1. Installations that already applied migration 31 retain their stored windows when upgrading to migration 32. Earlier agents cannot reconstruct historical thread activity. Enable observation.processExit to collect task creation, rename, and exit evidence; task.lifecycle/v1 is advertised only after all required kernel hooks load and attach successfully. processExec controls executable execution independently. The API defaults to the last hour and accepts explicit ranges of at most 31 days. Thread-activity windows follow the Project’s effective raw runtime retention. Expired windows are removed; there is no separate historical snapshot that reconstructs their counts. Created and exited counters cover the selected windows, including counts by observed name. Active counts by name and the observed peak are available only for one qualified process and observation epoch; when multiple processes or epochs are present, the summary reports these values as unavailable instead of adding incompatible snapshots. Observation gaps or truncation make creation and exit counts lower bounds; an incomplete baseline also affects active and peak counts.
Application inventory groups the same system call across Linux process threads. Open a retained raw occurrence when you need the originating process command. Runtime Groups remain process-aware; process creation, executable execution, and classified process termination remain distinct lifecycle evidence.
The termination and restart views put kernel evidence and Kubernetes evidence side by side: the process, the container it belonged to, the exit code or signal, the reported reason and any related observations. Read them together. A SIGKILL on its own does not mean the process was killed for memory — that conclusion needs evidence that says so. And a container restarting is a different event from a child process exiting.
Outbound, inbound and DNS
Section titled “Outbound, inbound and DNS”Outbound connect observations give you the destination address and port, the address family and how the syscall ended. They say nothing about the transport, so do not read TCP or UDP into them, and an attempt is not proof that a connection was established. Listen and accept observations are optional and describe the other direction: TCP listening endpoints and inbound activity that was accepted. Check which direction an observation describes before you compare it with another one.
DNS is off by default. Switch it on and you get bounded observations of plaintext UDP and TCP traffic on port 53: names, A and AAAA addresses, CNAME relationships, the response code and the TTL. A recent matching answer can annotate a connection with a name, which is convenient, but one shared IP can belong to several names, and correlation is not causation. Encrypted DNS stays encrypted, and Okoscope never fills a gap with a reverse lookup.
Application inventory presents one outbound endpoint or exact DNS identity even when several Linux process threads produced it. DNS entries keep the observed question name and A or AAAA type visible in the main list, with their own evidence history, policy state, filters, and pagination. The non-interactive top-five overview groups related resolver questions into logical destinations so Kubernetes search-expansion variants do not crowd out other frequently observed destinations. Those overview groups never change the list’s search or identity filters; the exact questions remain separate recorded identities below.
Experimental file activity
Section titled “Experimental file activity”File observation is opt-in, and you have to say what you want: which operations, and at least one normalized absolute prefix to include. Exclusions always win over inclusions. The syscall-path profile reports the successful operations it supports, using the paths the process passed in and the descriptor mappings it kept. It does not read file contents and does not resolve a canonical inode identity.
Relative paths, symbolic-link aliases and memory-mapped writes fall outside what this profile promises to see. Modifications are aggregated over a fixed five-second window, so rapid writes collapse into one observation. A successful open with O_CREAT does not prove a file was created; only O_CREAT together with O_EXCL does. Start with one narrow path that holds nothing sensitive.
Equivalent file operations over the same reported path are grouped across process threads in Application inventory. The originating command remains occurrence evidence.
observation: files: enabled: true operations: [create, modify, delete, rename] includePaths: [/app/data] excludePaths: [/app/data/private]Inventory, releases, policies and notifications
Section titled “Inventory, releases, policies and notifications”Inventory is where you browse what was seen — executables, network identities, file paths — together with the evidence still stored for each. Release comparison puts a baseline next to a target and shows how their behavior differs; where coverage has expired, the answer is unknown rather than no. So look at coverage first, then decide what a missing behavior means.
You can give any inventory behavior an application-specific name, whether it is a process, connection, domain, syscall, file operation or lifecycle event. For example, name an observed destination Database connection or a process Background request worker. The name is user-provided interpretation: Okoscope always keeps the canonical technical identity visible underneath it, and naming does not change agent evidence, grouping, counts or policy evaluation. Names are scoped to one Application, may be duplicated, are included in inventory search, and remain available when older raw evidence expires. A changed technical identity or identity-version does not inherit a name automatically.
Open an inventory card or its observation history and choose Add name. Any signed-in principal with access to that Project can create, edit or remove a name. Names contain 1–120 characters and cannot contain control characters. Concurrent edits are detected; when a conflict is reported, review the freshly loaded value before retrying.
Runtime policies record how you decided to treat a behavior when you reviewed it. They are a review tool: they do not install a kernel firewall and they do not block a syscall. Project notifications forward supported findings to the destinations you configured. Delivery is tracked separately from the finding itself, so check the delivery record and its attempts — an event in the interface does not mean a webhook arrived.
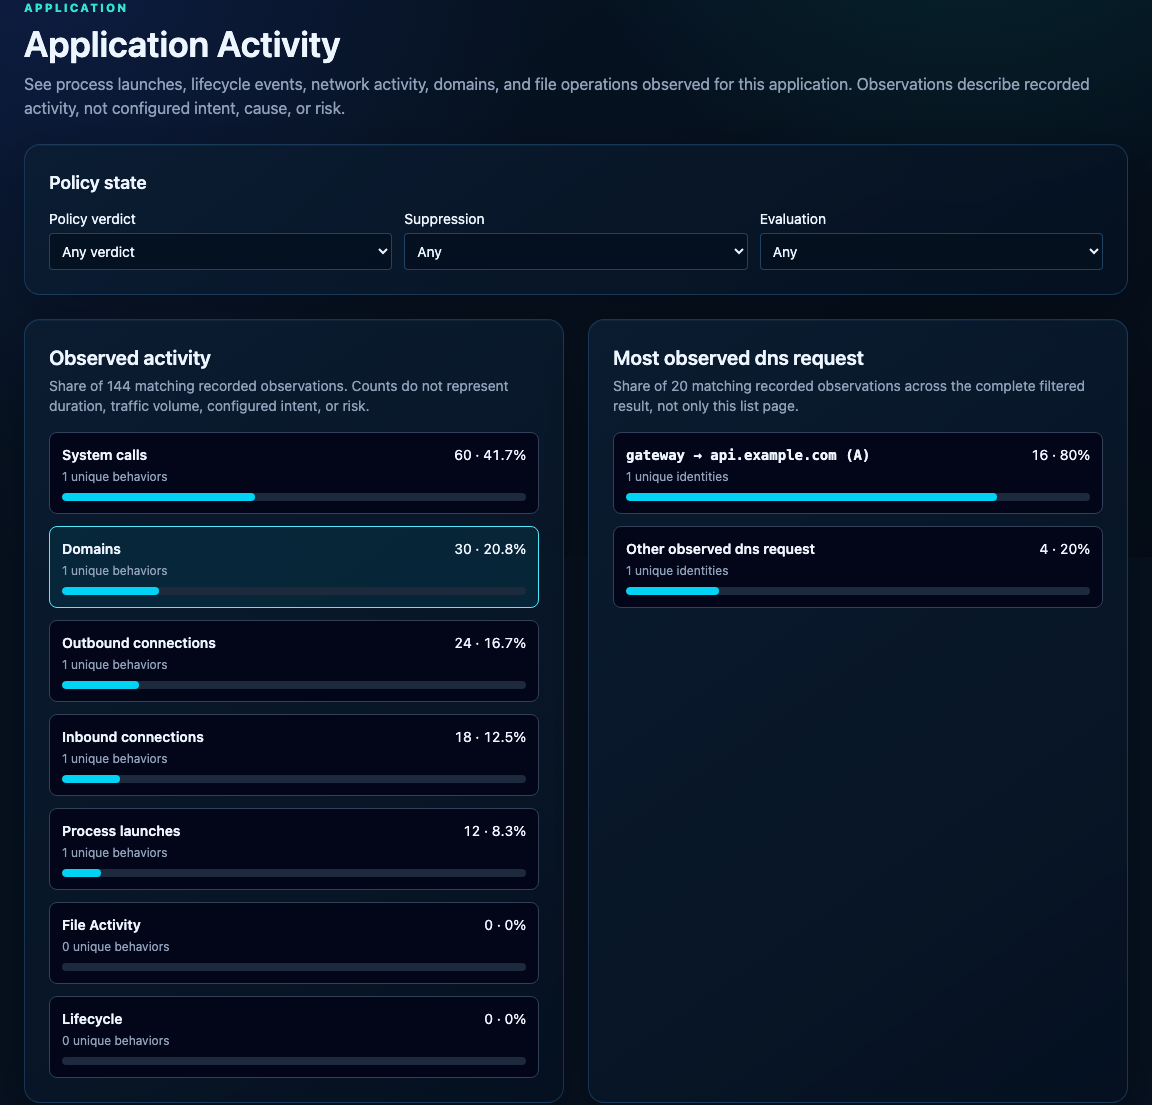
Application Activity is where inventory is browsed. Shares describe recorded observations, not traffic volume or risk.